Reporting Engine
Overview
You can easily create different reports based on your data in the kpi.com application as well as filter the report and draw graphs and charts for visual comparison. Besides, the reports can be exported to PDF or Excel which makes them helpful to use and backup your data. The default reports are also available on Accounting and Finance, CRM and Project Management that save your time from creating the report yourself.
Generate reports, backup, save and share
Besides the ability to generate custom reports using the Reporting engine, there are several useful built-in reports for each section like “Today’s Leads” for CRM, “Sales by Item” for Accounting, “Active Project” for Project Management and many more. Other additional benefit of the Reporting are:
- Multiple folders, ability to add, edit, and delete folders. Users can have both shared and private folders
- Report Templates
- Cloning reports copies data from existing report to a new one
- Tabular and summary reports
- Different charts available based on reports
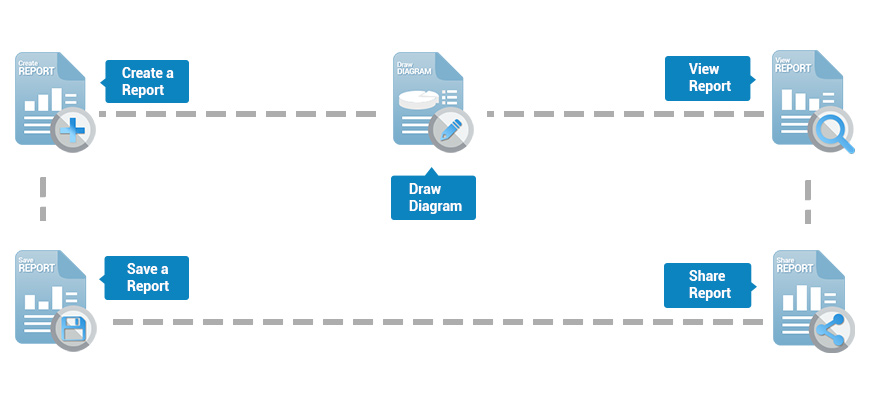
To create a new report, go to the Reporting tool and click on New Report button, then select data whether it is a lead report, timesheet report or sales report, go through the steps and generate it. For more information click here.