Gantt Chart
Overview
Kpi.com’s Project and Resource Management is an intuitive and flexible tool that allows managing your projects from initiation to execution. It seamlessly encompasses all necessary features required by managers, easily integrating with other parts of the system. Either small or big, projects can be delivered effectively, with kpi.com’s innovative technologies of tracking and reporting capabilities.
Organize and schedule your tasks
The Gantt Chart is an easy illustration of your project plan. To view the Gantt Chart of a specific project, go to the Project Summary and choose Gantt Chart from the left menu. To organize the tasks and workstreams, go to Work Breakdown Structure where you can add worktreams and include tasks under them which will allow you to view the Gantt Chart in a more clear format.
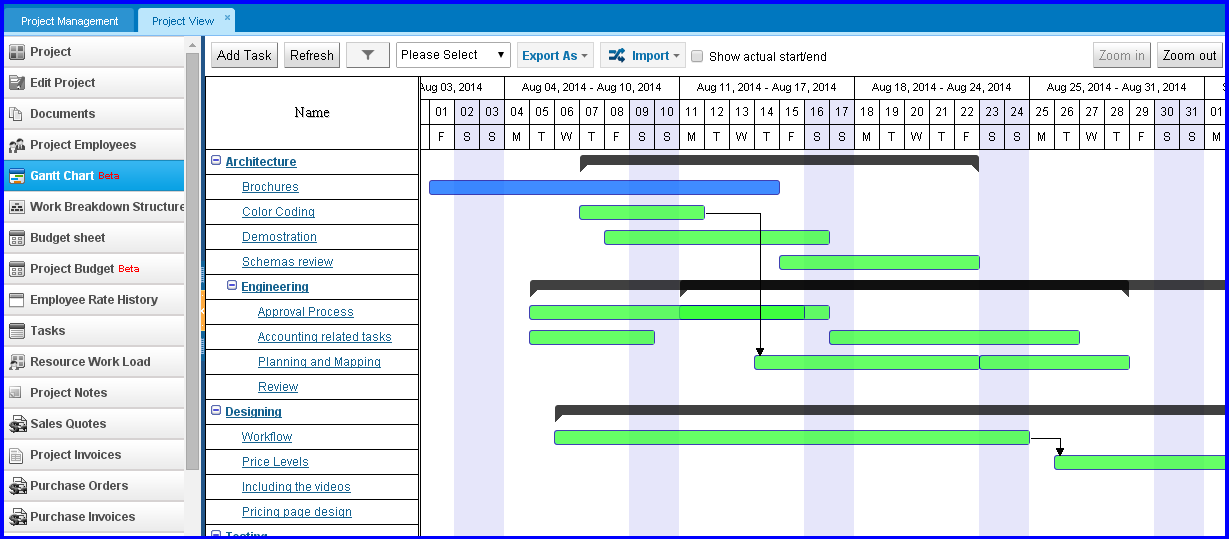
Some useful feature of the Gantt Chart tool include zoom options, drag and drop options to reschedule tasks, adding/importing tasks and exporting the chart to an Excel directly from the page itself.