


Key performance indicators, or KPIs, are the vehicle for long-term success for small- and medium-sized businesses. KPIs are a collection of quantifiable measurements that a business uses to evaluate or compare performance as it relates to operational and strategic goals. KPIs provide a foolproof management system.
Without KPIs, small businesses risk a tragic ending, and the studies make that clear. Small businesses fail at a rate of 20 percent in the first year, and only 30 percent of small companies will survive to see their 10th anniversary. Most of the endings are due to poor leadership or managerial dysfunction created by unclear objectives that could have been solved through KPIs.
In other words, key performance indicators provide a built-in management safety net that eliminates directional ambiguity and reduces conflicts that eventually lead to company-wide chaos, which saps morale and reduces the effectiveness of leadership.
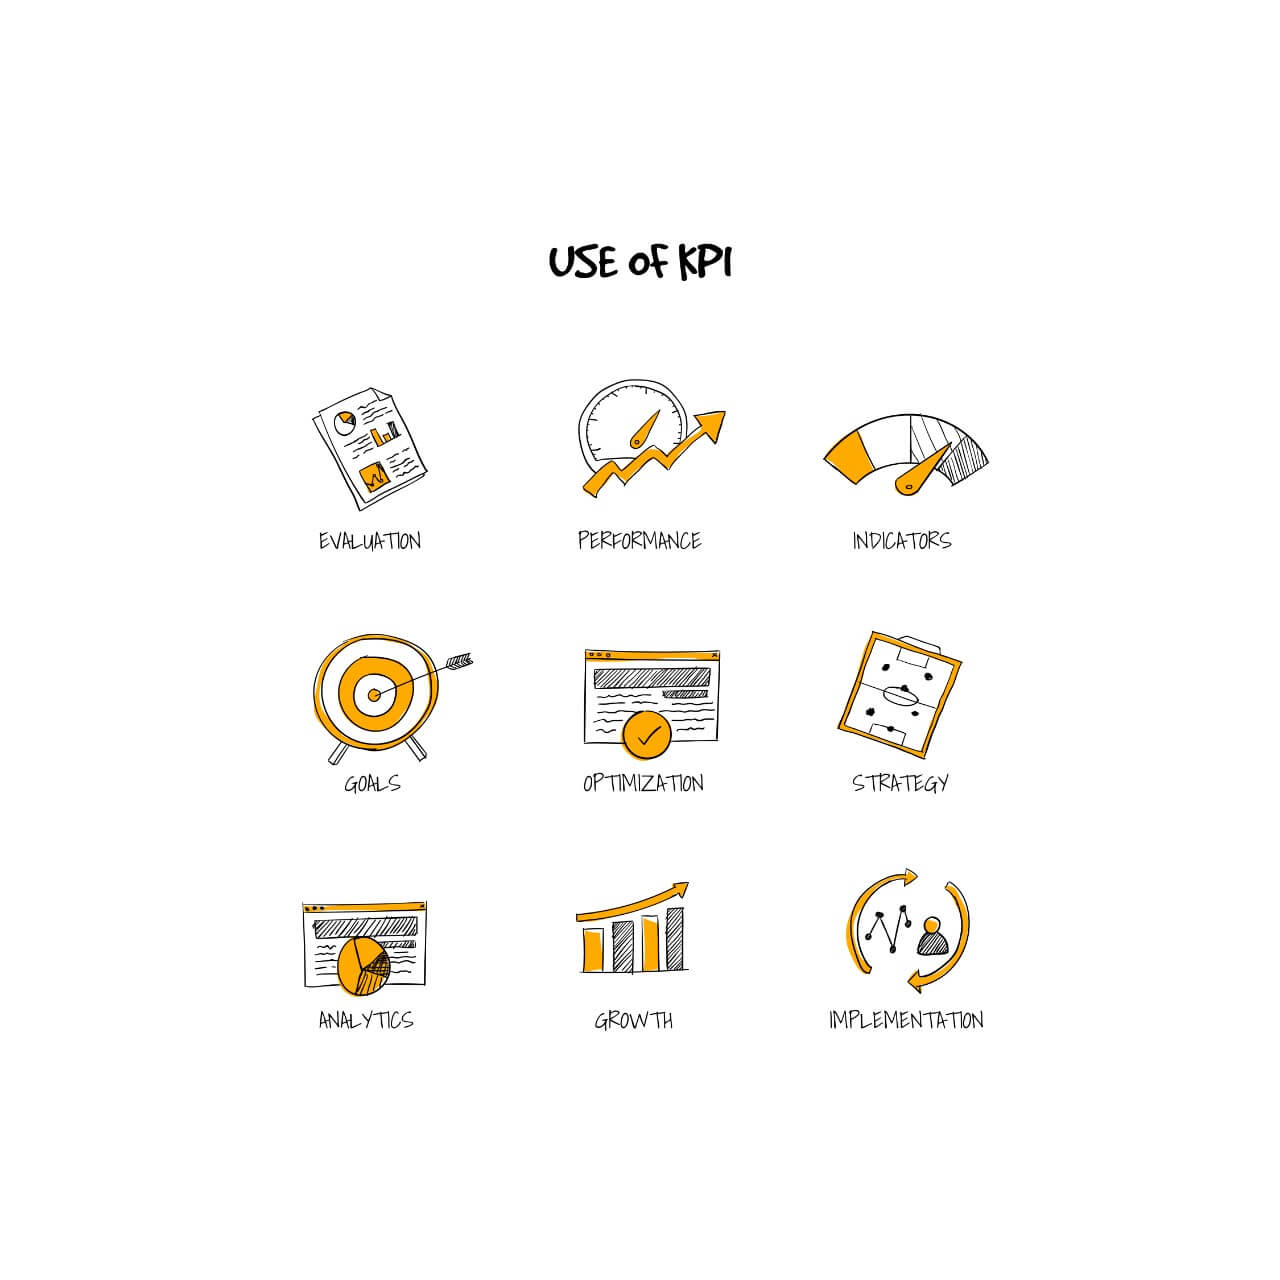
Use of KPIs
Key performance indicators are essential to reaching the objectives of a business. In other words, KPIs provide specific actions and behaviors that leaders and staff follow to achieve short-, medium, and long-term goals.
Perceptive small business owners and managers understand that measuring performance is the best way to stay productive, grow, and maintain the stamina to survive any challenge. Furthermore, with key performance indicators as a guide, average leaders become great leaders who deliver results every single day.
For example, say, your company’s goal is to increase earnings from the previous year by 5%. It is a great objective, but you cannot go into an all-staff meeting at the beginning of the year and present this goal without also having actionable steps that are clear and specific in order to get there. KPIs provide the impeccable and singular roadmap to get to 5%, or to get to any company objective.
This unique roadmap helps businesses make expedient and correct decisions on an ongoing basis, without fail. One of the reasons is because KPIs look at results; they are like the perfect leader that does not get emotional or take the middle of the road in a crisis. KPIs objectively keep initiatives on track, production high, and the entire company headed in the right direction.
Delayed decisions, and endless meetings without clarity, in an attempt to build consensus, are no match for the immediacy of key performance indicators. Proper statistical analysis found in KPIs quickly define tactics and focus on getting to results that support company goals. Furthermore, quick, overconfident decisions are just as bad as delayed ones without the backing of KPIs because managers can sometimes be overconfident in their judgments and at odds with reality. KPIs provide real factual evidence.
In addition, small businesses make the correct decisions with speed by developing and tracking KPIs within the company’s essential departments. Departmental key performance indicators help individual employees understand their roles within their department in order to make fast decisions and stay on track as they pursue company goals. Moreover, through KPIs, all of the departments can work together to reach company goals and contribute to the business’s overall successes, which increases efficiency of action.
Building a successful company begins with leadership skills and effective management, and when either one is missing, conflict and confusion rise through the ranks. When turmoil becomes a part of every week, morale slips and low productivity follows.
Small- and medium-sized businesses find it challenging to find solid leaders and reliable staff members because big companies snatch up the very best employees. Large businesses offer bigger salaries, better benefits packages, and other incentives that bring their company the cream of the crop, and those same salaries, packages, and incentives motivate their staff and maintain high morale even through difficult challenges.

Statistics show that 25.7% of small business employers have difficulty finding and keeping good workers, and 23 percent of small businesses fail because team chemistry never formed. These failures occur because of lack of communication and the absence of a collaborative work environment.
How can small businesses compete, grow, and profit, with so much working against them? It is simple, really. Small business can incorporate KPIs into the company’s business model to contend with big companies, zoom past businesses of equal size, and increase revenues.
You can level the playing field with the help of KPIs, as managers and staff use key performance indicators to work together towards singular goals with incentives attached that create positive, forward momentum. This movement creates strength in the leaders and provides motivation for everyone in the chain of command to stay productive.
Furthermore, KPIs encourage accountability, which is not an easy thing to do. It is human nature to point fingers when things fall apart at work. However, KPIs hold employees responsible for improving the key performance indicators that are under their control. KPIs also help managers measure the performance of their staff. With ease, employees can quantify their contributions and managers can tell which employees are contributing the most to company goals.
This measure of accountability motivates employees to perform better because they can actually see the needle move when they complete a stage as they move towards their individual, departmental, and company goals. Managers and their department or team feel empowered to make a difference, which improves morale. High morale leads to improved productivity that stabilizes a small business and encourages growth and more profit.
The important KPIs simplify and align relevant measurables to achieve more in a timely way that is visible to everyone in the company as individuals and departments. Net profits are only one of numerous factors that influence your company’s balance sheet; KPIs go deeper. They provide a transparent way to show how you can grow and generate more profit by providing your business with countless measurables.
If you are a small business owner you undoubtedly understand the need for setting goals and targets to be successful within your industry. A great way of creating these are by introducing SMART key performance indicators (also known as KPIs). But to understand how you can utilize these within your business, it’s important first to understand what they are.
S.M.A.R.T. KPIs
KPIs and metrics within your business allow you to measure and track its performance. You might often hear the acronym “S.M.A.R.T” without really knowing what it’s talking about. Smart goals or objectives allow you to bring clarity to your business by looking into its measurability and what you can do to increase your profits. Evolving an aim into a realistic target, it’s an invaluable method.
S.M.A.R.T. stands for:
- Specific: what do you want your business to achieve?
- Measurable: how do you identify whether or not goals are achieved?
- Achievable: will you be able to achieve your goal successfully?
- Relevant: is it a pertinent goal within your business?
- Time-bound: when do you aim to deliver the goal?
Demonstrating how you can achieve your businesses key objectives and evaluating the success of your business, they are used by a variety of industries across the world. KPIs can often be split into two levels: high and low. High-level KPIs might focus on the performance of the business as a whole, taking into account its sales, profits and budgets. Low-level KPIs, on the other hand, might focus on how different departments are performing.
SMART KPIs aren’t only used by big organizations. They can also be used by small businesses looking to improve their business strategy and their performance. Invaluable when it comes to making decisions, it will ensure that there are goals to work towards and they can help you to create solutions. So what are the main benefits of SMART KPIs?

They allow you to set a benchmark: giving you a point of reference, so you can compare how your business has performed in the past and compare it to how you expect it to perform in the future.
They help you to see where your business stands: KPIs will help to clarify what your business’s current position is within the market – helping you to identify ways in which you can improve.
They help you to focus: outline the aspects which require attention; it will allow you to focus on ways to overcome any issues and work on certain elements that are failing.
They motivate employees: once your employees know what they are working towards, they will be motivated to succeed.
They help you to identify any inefficiencies: this way you can eliminate anything that isn’t successful.
They help with accountability: they will highlight which departments are successful and which ones aren’t – this monitoring will help you to make any changes within the structure to help with business development and growth.
Those are just some of the benefits that come with SMART KPIs when you are working within a small business. For these to be successful, however, it’s important that you create a clear objective for them. A crucial step in developing KPIs within your business, they need to be connected with your main business objective and goals.
They need to be realistic and achievable, including goals that will have a significant impact on your organization. You don’t want to waste time and money in creating KPIs that aren’t possible. You want to thoroughly analyze your business and think about where you want to be in the future.
SMART KPIs can be developed by taking into account what your businesses’ metrics are. From web traffic to productivity and sales figures, KPI’s can indicate which metrics you should monitor and the steps that you can take to monitor them.
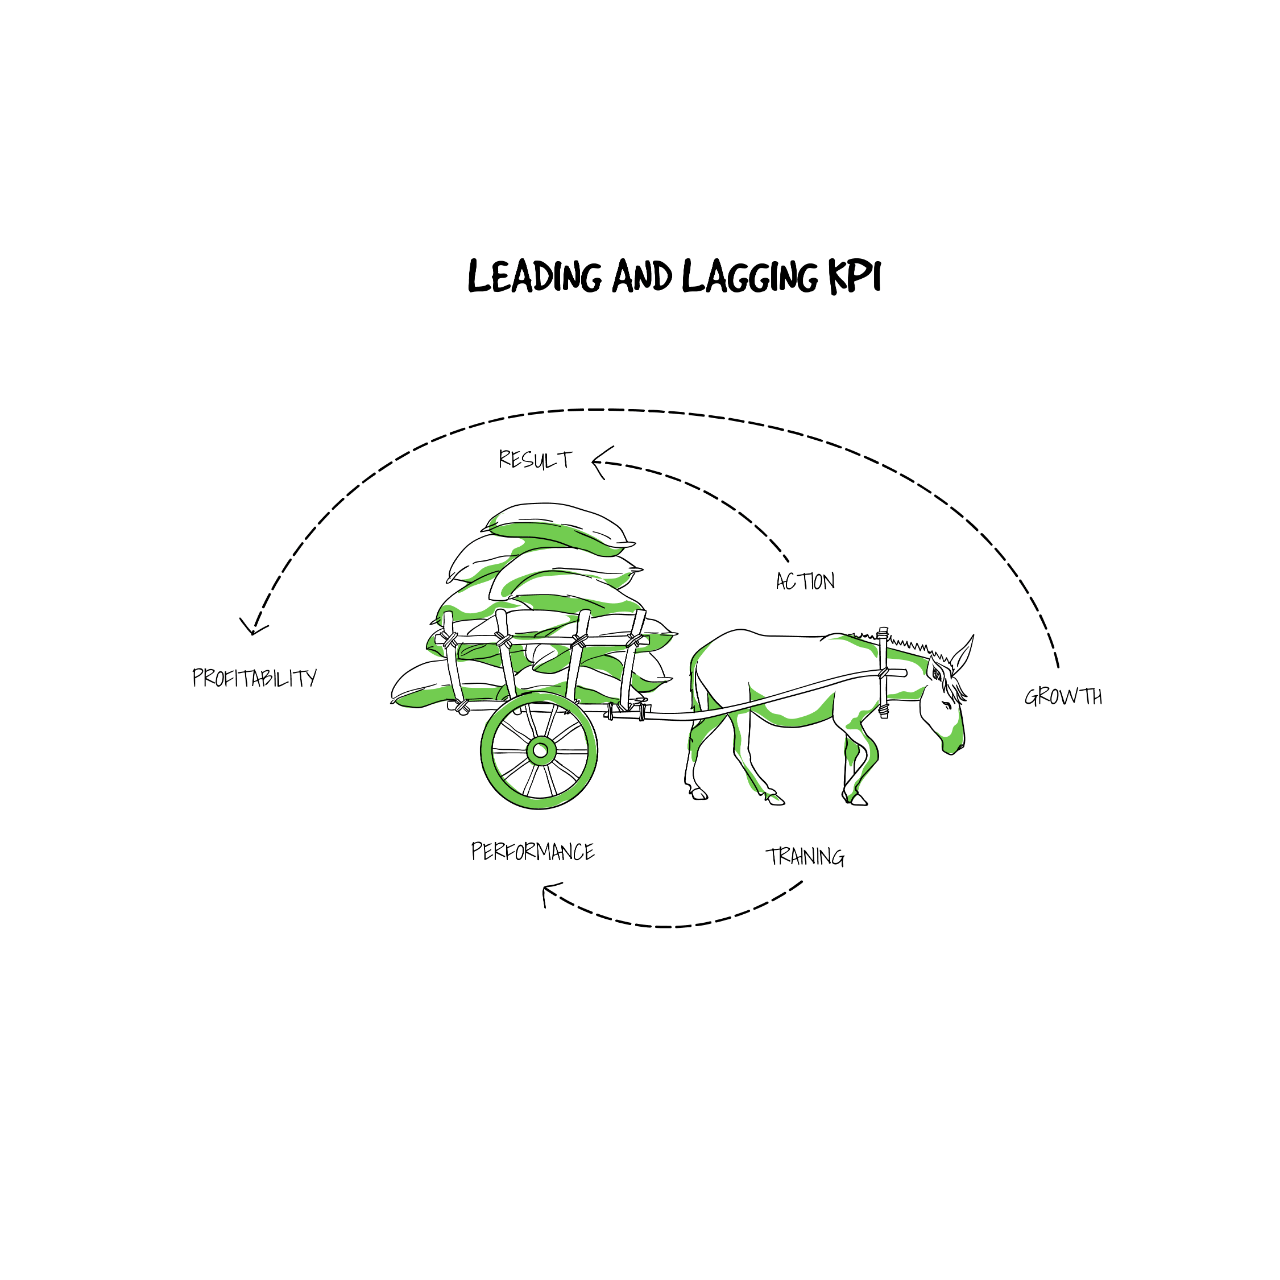
Leading and Lagging KPIs
You might also often hear the terms ‘leading and lagging KPIs’ when researching into how you can use KPIs within your small business. Words that are often exchanged throughout the business world, in order for your small business to create KPIs that are effective, it’s important first to understand exactly what they mean and how they differ from one another.
What are Leading KPIs?
Firstly, let’s investigate what leading KPIs are. A leading KPI can be utilized as it can predict any changes that occur within the company. A measurable factor that alters before they start to follow a trend or pattern, they can indicate a negative or positive initial result.
However, one thing to consider with leading KPIs is that they can’t always predict an accurate outcome as they simply consider how the business is currently performing – not how it will stand within the market at the end of the month/year.
What can Leading KPIs indicate?
- The percentage in growth
- The percentage of growth in new markets
- How many people are viewing the website
- The number of new visitors/customers
Even though leading indicators are useful for a small business, it’s important to look at the lagging KPIs alongside the leading KPIs so that you can get a more accurate picture of your businesses current and future performance.
What are Lagging KPIs?
Lagging KPIs record the performance of a business and are an output-oriented method. Taking into account the performance of the business (as well as the indicators which are mentioned below), it allows you to measure how successful certain elements are within your business structure. Unlike leading KPIs, they will measure this performance after the business has followed a trend or pattern – confirming how it will perform in the future if it carries on this way.
What can Lagging KPIs indicate?
- If there is a growth in annual sales
- What the annual sales are
- The annual net income
- If there was any growth in the annual net income
- What the gross margin is
- The earnings before interest, taxes, depreciation and amortization
It’s important to know that KPIs can be a mixture of both leading and lagging, depending on the process that your business follows. It is therefore vital that you understand what the relationship is between them and how you can utilize them within your objectives/how they will indicate what the future of your business is like.
If used correctly, they can provide you with unique and helpful insights into how your business is performing within the market and what its potential future position will be. Regardless of whether they are lagging or leading, it’s important that the trends that are laid out by the KPIs are acted upon in order to be successful and for you to get a true insight into how your business will stand after a set period of time.
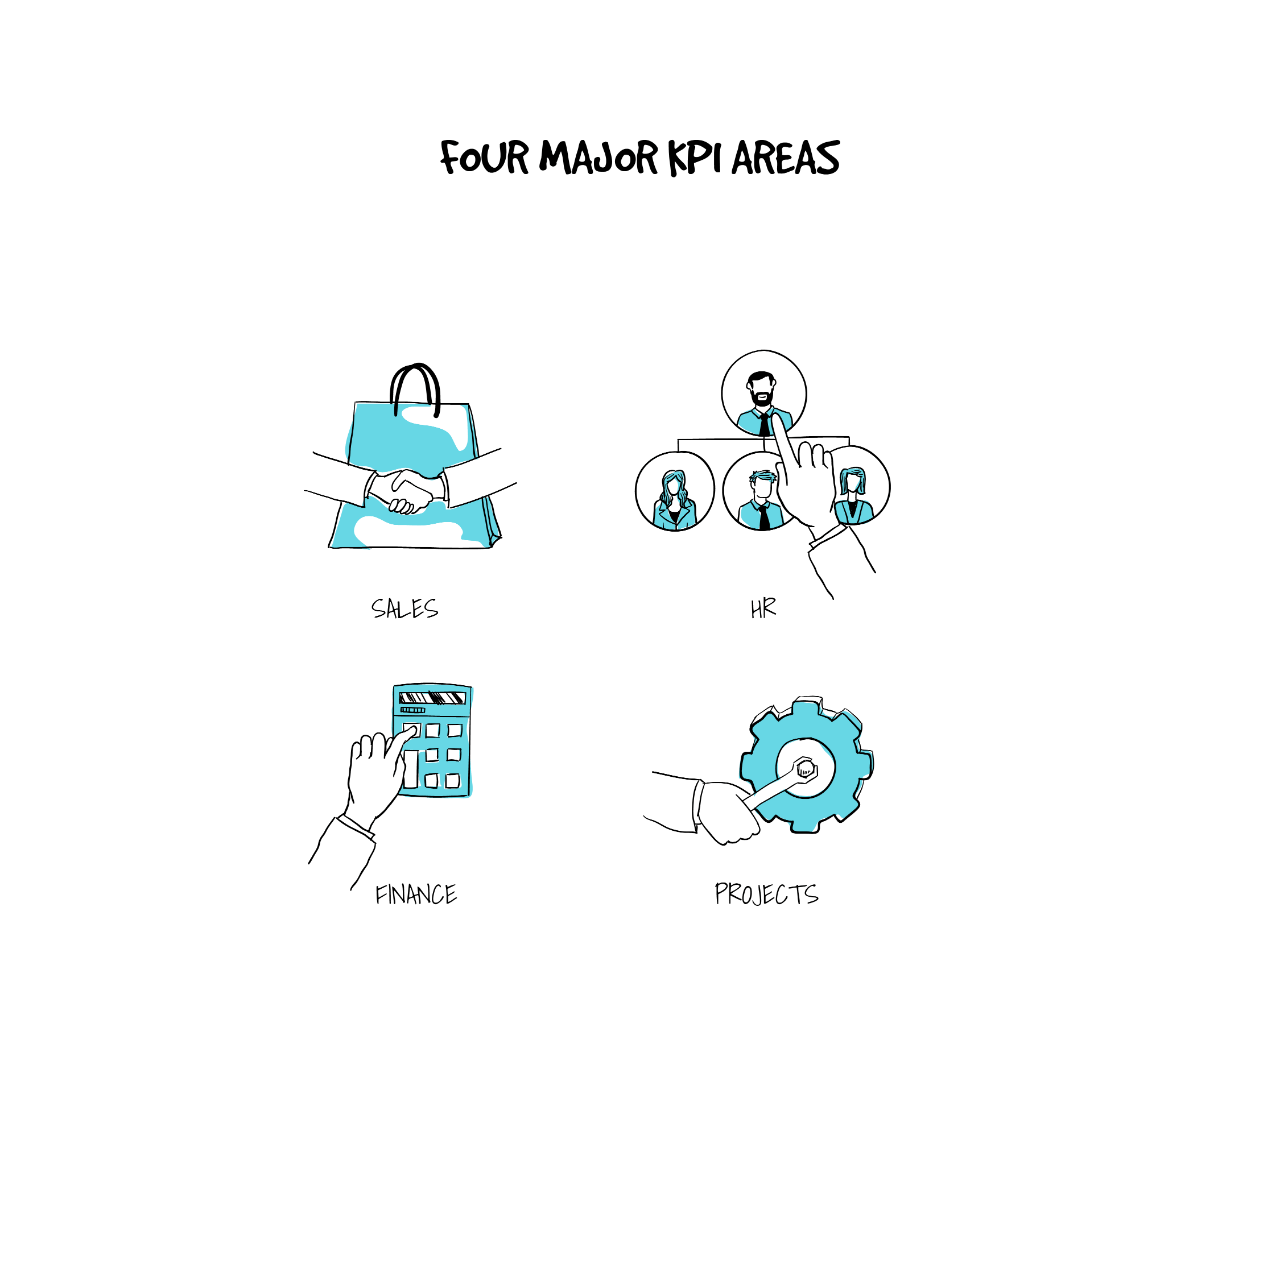
Four major KPI areas
KPIs should not be one set of company-wide metrics, but there should not be so many sets that the performance indicators become convoluted and complicated. It is important to focus on your four major company concerns, which include sales, personnel, finance, and projects.
Furthermore, to simplify the process even more, you must pare down the plethora of industry KPIs to those that help your company move steadily forward, because you do not want to slow down your daily business down with unnecessary administrative bureaucracy.
The following are KPIs to consider for each major department:
Crucial KPIs for Sales Department
- Sales Growth and Profit (Obviously, profit is the most important performance indicator and your business must track it for growth and returns. Moreover, by understanding the trends in your sales growth, you can strategize efficiently and effectively and remove tactics that fail to convert.)
- Sales Pipeline (How many leads come into your company’s sales funnel and what is the conversion rate of leads to customers? Which strategies result in the best closing ratio and where are the holes in the sales funnel? How many leads abandon the sales funnel prior to completion, and why?)
- Rate of Follow-up Contact (Considering that 48% of salespeople never follow up with leads a second time, and 10% of sales are closed on the fourth contact, while 80% are made on the fifth to twelfth contact, this KPI is crucial.)
- Relative Market Share (How is your company performing relative to its competitors in the same space?)
- Customer Lifetime Value (It is critical to find out what each of your customers is worth by comparing their revenue stream with the total cost to acquire and keep them. Thereby, you can determine their overall worth to your company and get the details of the segments that return the highest profit.)
Crucial KPIs for HR Department
- Retention of Talent (This KPI indicates the job stability of your company, and allows you to learn what factors contribute to employee retention and loss. High staff turnover means high costs for your business.)
- Average Tenure (Employee retention and loss are closely related to the time employees remain in the same position, so it is important to track career growth, so that good employees are rewarded and do not look for new opportunities outside of your company.)
- Absenteeism Rate (Measuring the absences of employees because of tardiness, sick leave, and excused or unexcused absences help expose issues of low morale, inadequate work-life balance, and problem employees.
- Education and Training (Tracking education and training helps determine personal growth strategies for employees to increase loyalty and satisfaction in the workplace, which boosts retention and productivity.)
- Employee Productivity Rate (Measuring the efficiency of your employees helps determine how long it takes them to accomplish tasks and goals that have been set for their position.)
Crucial KPIs for Accounting Department
- Accounts Receivables (This critical KPI alerts your business to all outstanding payments and the length of time it takes specific customers to pay their bill to help maximize the efficiency of your payment collections.)
- Accounts Payable Turnover (By knowing the rate that your company pays off its suppliers, and then comparing the payments over several periods, you can take action to pay off suppliers in a timely fashion if the accounts payable turnover is falling.)
- Inventory Turnover (To meet demand, your business must keep your product or service inventory flowing seamlessly, and this KPI helps you determine how much inventory you’ve sold in a given time period, and the strengths or weaknesses of your sales force.)
- Working Capital (By tracking assets such as cash, short-term investments, loans, accounts payable, and accrued expenses, you can develop a picture of your business’s financial health as you evaluate available assets that meet short-term financial liabilities.)
- Net Profit Margin (It is important to calculate your business’s effectiveness at generating profit on each dollar of revenue made, and the net profit margin considers costs of sale and nuanced expenses like administration, which helps you make immediate and long-term financial decisions.)
- Revenue and Revenue Growth Rate (There are many subcategories of “revenue” that you will want to monitor, but an important metric is revenue growth rate, which calculates the rate of revenue growth during certain cycle periods.)
- Revenue per Employee (You can optimize the productivity of certain employees before hiring more staff, and determine if hiring new employees or terminating current employees will increase net profits)
- Order Fulfillment Cycle Time (This crucial KPI provides information regarding the internal efficiency of your business, from supply chain efficiency to the timely shipping and delivery of products and services, which is important from operational efficiency and customer satisfaction outlook.)
- Cash Flow Forecast (This KPI assesses whether your business sales and margins are appropriate so that you can assess problems in the early stages to make necessary adjustments and anticipate upcoming surpluses or shortages.)
Crucial KPIs for Project Management
- Planned Value (The estimated cost of planned project activities as of the reporting date help keep projects on track and on budget.)
- Earned Value (This KPI shows the approved budget for all of the performed project activities by a specified date, and how much planned work the project team has completed, along with the remaining budget for future work.)
- Task Cycle Time (The time that is required to complete specific tasks or activities is helpful when repeating tasks in a project and finding out if teams complete tasks by a given deadline.)
- Employee Time Spent (The time that team members spend on the project helps to determine each member’s necessity and involvement.)
- Budget Variance (This KPI determines how much the “actual” budget varies from the “projected” budget.)
- Budget Line Items (This KPI helps small business owners and managers track individual expenditure and provides a detailed way to see how the team used the budget.)
- Customer Satisfaction (The bottom line of any project is customer satisfaction. Will the customer remain loyal to your company and share positive feedback? A simple survey works to track this KPI.)
KPI visualizations
Unfortunately, nailing down KPIs to the factors that drive your business is not a simple process. Many companies spend significant amounts of time tracking metrics that have no influence on actual results, and the formulas to monitor all that needs to be tracked is complicated.
Simply put, there is too much data and it is often non-aggregated. Small business owners and managers need KPI software that automates the tracking of important statistics, and more importantly, presents the information in an easy-to-understand way, so that performance is easy to follow and trends are easy to spot.
Platforms with user-friendly dashboards provide a centralized hub for a business’s decision-makers to pull data and build pathways to company goals, as well as compare results across departments to assure that all goals are reached in an efficient and effective manner.
KPIs can be visualized in an array of ways, including through dashboards. A dashboard is an invaluable tool that can be used for information communication and data management as it can display a businesses metrics, KPIs and measures.
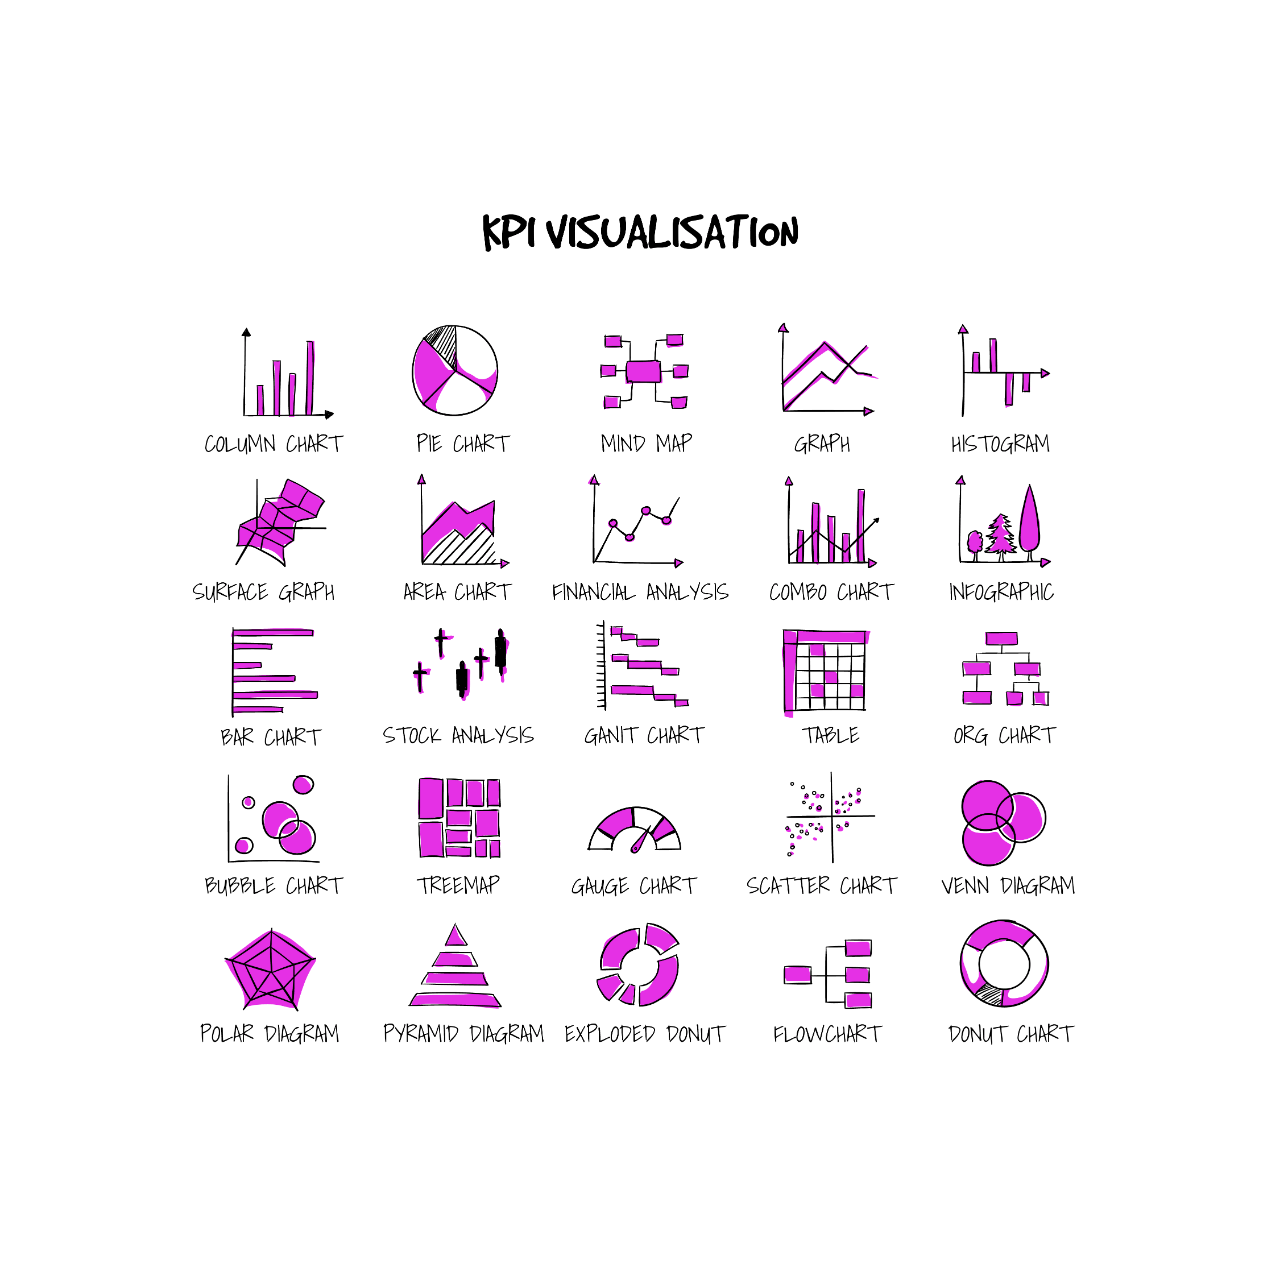
A visualization aid that can contain charts and graphs, it lays everything out so that it’s in a simple to use format. Widgets are features within the dashboard which can display both the current status of the KPIs and the target through these formats. Depending on the software you are utilizing, you can use the KPI widget to:
- Display specific metrics
- Display comparison periods (after you set a 1st and 2nd)
- Create a chart that highlights key data
- Create alerts for your KPIs if there is a decrease in sales, growth, etc.
KPI dashboards are handy tools that can be used to monitor your business’s performance, demonstrating its current sales/profit alongside how it compares to its past performance. Giving you the ability to look at real-time charts and graphs, it’s a must for any small business that wants to develop within their industry and grow organically.
They can also be tailored to fit your businesses in-house style – matching it to other material that your employees currently use so that they are familiar with it. But those aren’t the only benefits that come with utilizing dashboards within your small business. They can also allow you to:
- Create detailed reports based on the data
- Store all of the data in one place, making it easier to analyze
- Share the data with both your employees and clients in a way that’s easy to use and simple to understand
- Provide a main focal point for everyone within the business, so that they can concentrate on achieving a certain goal/s
- It can pinpoint the exact negative trends, allowing you to correct them before they develop into major problems
KPI visualization aids undeniably have many benefits that a small business can reap. Instead of delivering your KPIs in a format that’s hard to follow and full of complex content and data, you can easily distribute the dashboard throughout your business so that your employees have something to measure their performance against. Opening it up to the wider company, it will allow for strategies to be created which will work on the elements that need it.
It will also allow you to analyze how your performance compares to your competitors – through showing your profits for example.
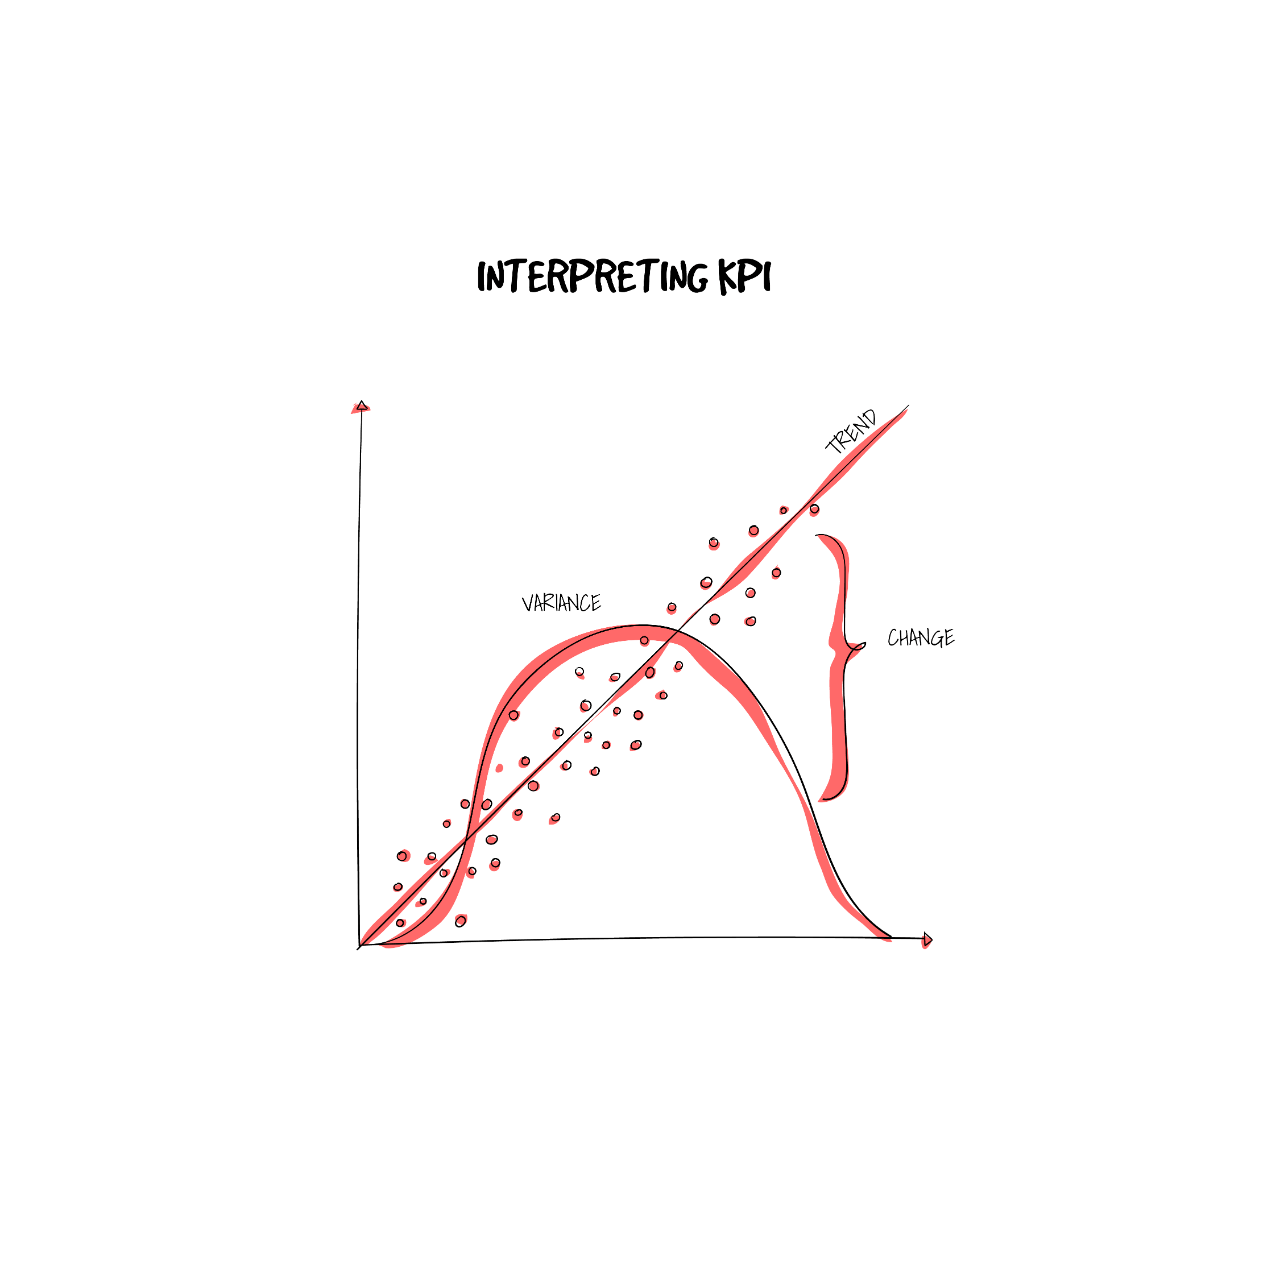
Interpreting KPIs
In order to interpret KPIs, it’s important to understand what the trends are (and how you can use them), what the net change is and what is meant by KPI variance.
Trends
First, let’s take a look at KPI trends. As mentioned above, your KPI dashboard can indicate how your business is currently performing in comparison to how it performed in the past. By using a visual indicator such as a side by side chart or a time chart, you can see what the trends are, using them to determine a strategy that will help with future growth.
You can easily view the trends quarterly or yearly (depending on the software you use), allowing you to spot a pattern between them. This trend analysis is key in determining the next move for your business and what you have previously done that has resulted in a certain outcome.
Through this dashboard, you can collate the information through a KPI trend report, which will directly compare the data and highlight what the pattern is in a more straightforward way than trying to spot it by simply looking at the figures within the dashboard.
Net change
Alongside the trends, KPIs can be used to demonstrate what the net change is within your business. Demonstrating what the difference is in terms of the profit, sales and other financial aspects of the business between a period of time, it will allow you to set new objectives within your business if there is a negative outcome. Measuring the performance of your business on a daily, weekly, monthly or yearly basis, it will allow your business to understand what it must do in order to improve.
Variance
It’s essential to know that the KPIs can report what the variance is between the performance of the company with what its target is. A quick way of monitoring the success of the business’s process, it allows for forecasting and to anticipate a certain outcome. When it comes to planning, management and reviewing the performance of your business, variance analysis is an invaluable tool that a business of any size can use.
Often represented as a percentage, it measures a KPI in comparison to a pre-defined baseline that has previously been set by the business. Paying close attention to the results of a variety of key performance indicators, it directly assesses any deviations from the results – revealing a clearer picture of your business.