PREFACE
Welcome to the new edition of kpi.com Reporting System Guidebook.
This Guidebook is designed to instruct you through kpi.com Reporting System features and it is the primary
assistant in case, you have any frustrations using the system tools.
assistant in case, you have any frustrations using the system tools.
kpi.com Reporting System User`s Guide contains information on getting to know and using the system features.
of creating and working with reports.
through several steps to run a report.
About kpi.com Software Company
kpi.com™ Software Company privately held by UK-based Finnet Limited firm. kpi.com provides an
integrated stripe of software products for project management, customer relationship management,
management of accounting and finance, e-commerce, reporting and human resources management.
kpi.com enables companies to integrate the products to personal computers, minicomputers, network
computers and personal digital assistants.
kpi.com, is a simple, low-cost ‘All-In-One’ Cloud based Business application platform. The integrated suite
of applications has been designed to remove the necessity of investing in on-site back office administration
and control systems, thereby allowing firms to concentrate on delivering their core, value adding services
to their customers. Delivering the solution via the Cloud enables management and staff to share
information and manage their operations regardless of location, thereby increasing their efficiency,
responsiveness and competitiveness whilst minimising their investment in operational overhead.
kpi.com’s cloud delivered SaaS ensures that all elements of the business are connected. Information, staff,
sales and service, front office operations, back office functions, management and control are available
immediately from any location and can be shared across the organization.
Customer Feedback
We appreciate you using our kpi.com Reporting System and this Guidebook.
Our customers’ comments and feedback are always welcome. You will find the Reader’s Questionnaire
Form about kpi.com features at the end of the guide. Do not hesitate to mail your comments and wishes to
the following e-mail address or you can directly contact with your kpi.com Support Manager.
Form about kpi.com features at the end of the guide. Do not hesitate to mail your comments and wishes to
the following e-mail address or you can directly contact with your kpi.com Support Manager.
E-mail: support@www.kpi.com
Phone: +44 () 844 484 1120
+44 (0) 844 484 2958
+44 (0) 844 774 2253
+44 (0) 208 313 0711
+44 (0) 844 484 2958
+44 (0) 844 774 2253
+44 (0) 208 313 0711
GETTING STARTED
kpi.com Reporting System is the best way to get the reporting done and the smartest way to manage your
projects, customers, employees and the entire business. It certainly helps a lot in budgeting and planning,
analyzing sales and purchasing. Without much hard work, it consumes less of your time. It is beneficial for
all types of companies and organizations for the purpose of generating reports where the business
statistics flow a lot.
HOW TO GET AN ACCESS
You can access to kpi.com Reporting System by copying and pasting the following web address on your
address bar since you are logged in:
address bar since you are logged in:
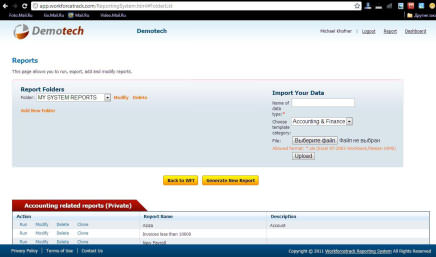
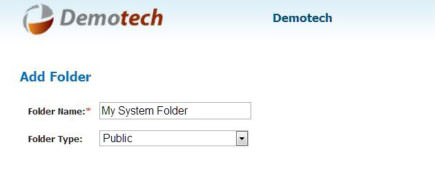
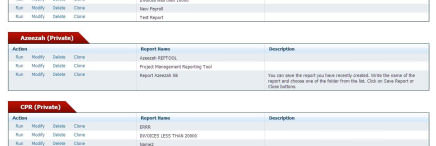
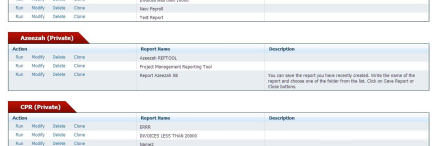
REPORT FOLDERS
In the Report Folders list, you can find created folders in the system. Running a report depends on the
folder you choose since all data is extracted from that section. You can directly Modify and Delete the
folder you choose. Besides, you can add a new folder by clicking on the Add New Folder button.
folder you choose since all data is extracted from that section. You can directly Modify and Delete the
folder you choose. Besides, you can add a new folder by clicking on the Add New Folder button.
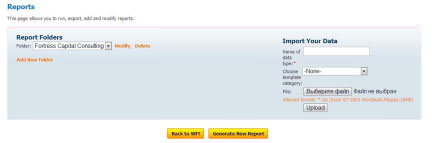
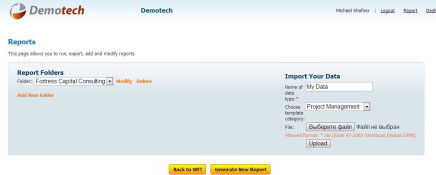
IMPORT YOUR DATA
To import your data, write the name of your data type in the Import Your Data section, choose template
category and click on the Choose File button and Upload it.
category and click on the Choose File button and Upload it.
REPORT MANAGEMENT
kpi.com Report Management was designed to improve your productivity and value, save your company
budget, and make your job easier than it is now. Due to the constant reporting in some businesses, there
have been developed several ways of gathering data to compile reports. So, let’s get started managing our
reports:
budget, and make your job easier than it is now. Due to the constant reporting in some businesses, there
have been developed several ways of gathering data to compile reports. So, let’s get started managing our
reports:
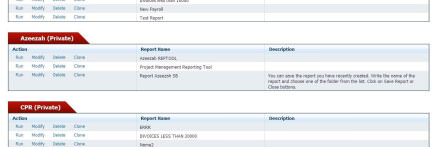
HOW TO VIEW
To view the existing reports created by other employees/users of the system/organization, you need to
scroll down the page of Reporting System and click on the Run buttonfrom Actions of Public/Private
reports.
scroll down the page of Reporting System and click on the Run buttonfrom Actions of Public/Private
reports.
HOW TO MODIFY
It is very easy to edit the reports in your reports list. You need to click on the Modify button from Actions
of Folders part.
of Folders part.
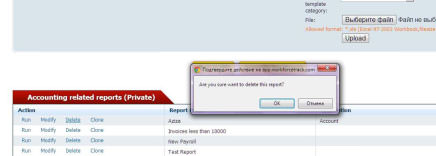
HOW TO MODIFY
To delete a report, you need to click on the Delete button which is found from Actions of Folders part.

HOW TO CLONE
To clone a report, click on the Clone button from Actions of Folders folder.
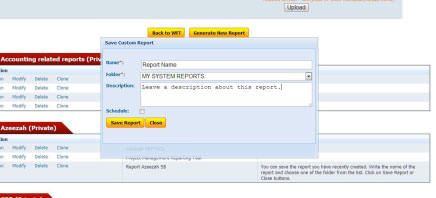
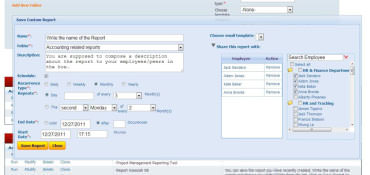
The screenshot illustrates other options regarding the Save Custom Report. Click on the Schedule/i>, choose
recurrence type, repeats, choose an e-mail template and share it with other employees.
recurrence type, repeats, choose an e-mail template and share it with other employees.
CREATING REPORTS
Compiling a report is as easy as one, two, three but you need several minutes to do so. You are advised to
go through several steps indicated above your screen while creating a report.
go through several steps indicated above your screen while creating a report.
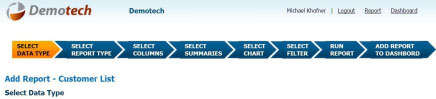
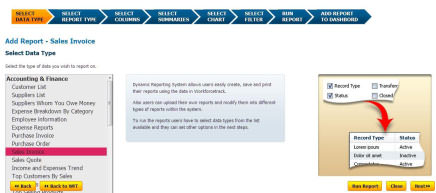
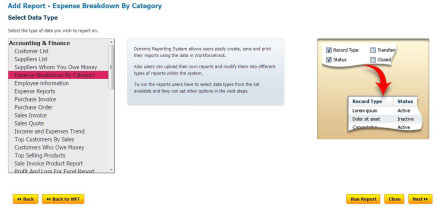
SELECT DATA TYPE
You will be given several options and it’s up to a report type you are going to create. Select the type of data
from Accounting and Finance, CRM, Project Management, Surveys & Polls and HRMS sections.
from Accounting and Finance, CRM, Project Management, Surveys & Polls and HRMS sections.
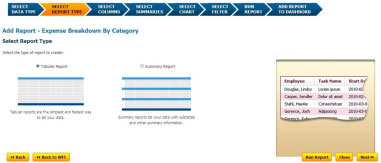
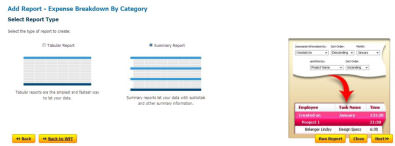
SELECT REPORT TYPE
The next step is selecting the report type. You will be given two options: either Tabular Report or Summary
Report. The former type of report is the fastest and easiest way to list your data. From the latter report
type you will be able to view data with subtotals and other summary information.
Report. The former type of report is the fastest and easiest way to list your data. From the latter report
type you will be able to view data with subtotals and other summary information.
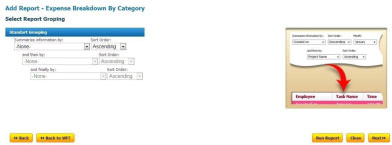
If you want your report to be in Summary format, you will be asked to Select Grouping. Since you have
done standard grouping, click on the Next button that is located in the bottom right of the page.
done standard grouping, click on the Next button that is located in the bottom right of the page.
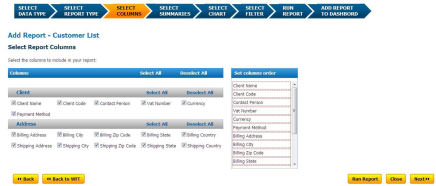
SELECT COLUMNS
On this page, you need to choose columns to include in your report. You are able to set those selected
columns by order.
columns by order.
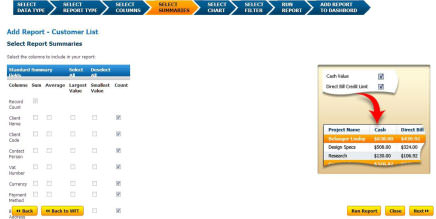
SELECT SUMMARIES
In this section, you need to select Standard Summary Fields by clicking on theSelect All button.
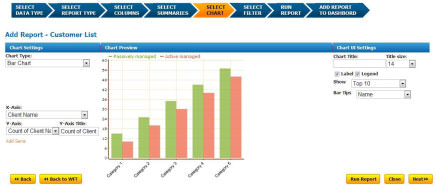
SELECT CHART
In Chart Settings, there is a list of Chart Types. You can select any kind of chart (Bar chart, Pie chart,
Horizontal Bar, etc) as regards to the type of your report.
Horizontal Bar, etc) as regards to the type of your report.
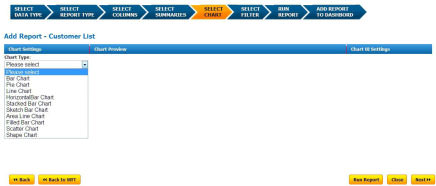
Other columns as Chart Preview and Chart UI Settings will perform their own duties after selecting
appropriate type of chart.
appropriate type of chart.

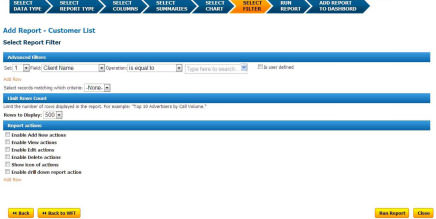
SELECT FILTER
Select Filter section views three types of rows:
RUN REPORT
We are here in several minutes as we decided a while ago. Click on the Run Report button and see what
does the compiled report look like?
does the compiled report look like?
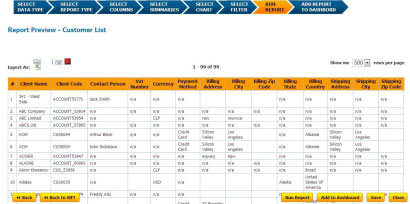
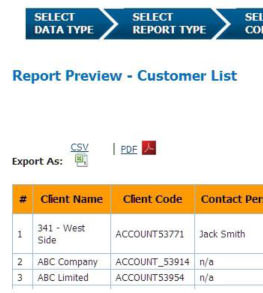
You can export the reports as CSV and PDF formats
READER’S COMMENT FORM
kpi.com Reporting System welcomes your comments and suggestions on the quality and this publication.
Next revisions will be based on your information.
Next revisions will be based on your information.
1) Were there any errors in the Guidebook?
2) Do you need more information? And in what section?
3) Were the screenshot examples enough?
4) What features were useful in this manual?
If any errors are found or you have other suggestions for the product and its manual improvement, please
send us your comments through the following ways:
send us your comments through the following ways:
E-mail: support@www.kpi.com
Phone: +44 () 844 484 1120
+44 (0) 844 484 2958
+44 (0) 844 774 2253
+44 (0) 208 313 0711
Postal Service:
Finnet Limited
Sun Alliance House
29 London Road
Bromley
United Kingdom