Dashboard
You can easily create different reports based on your data in the kpi.com application as well as filter the report and draw graphs and charts for visual comparison. Besides, the reports can be exported to PDF or Excel which makes them helpful to use and backup your data. The default reports are also available on Accounting and Finance, CRM and Project Management that save your time from creating the report yourself.
My Workspace and Dashboard
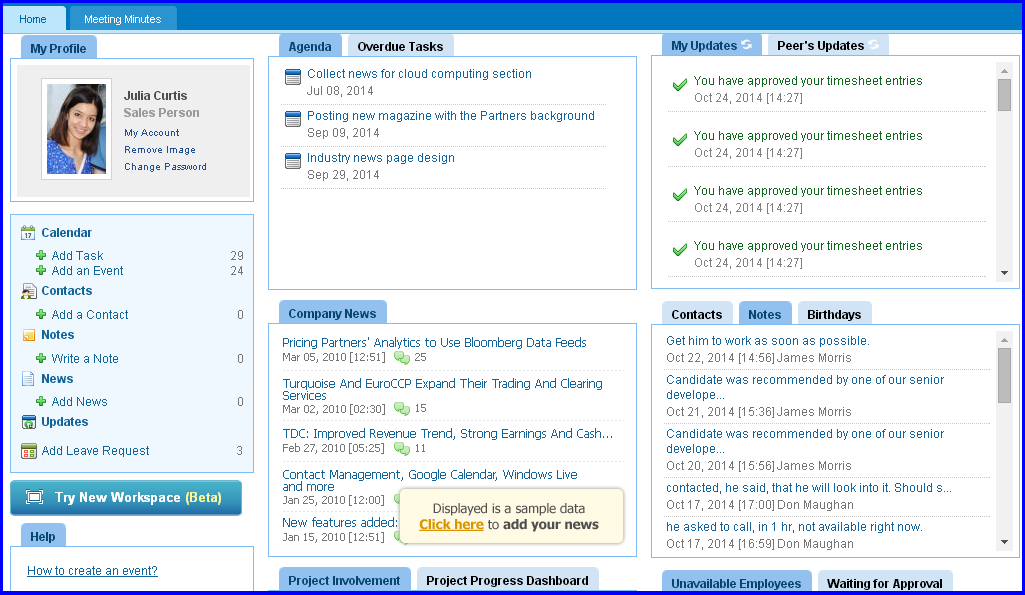
My Workspace section quickly summarizes some events and actions due in the system; You can view weather forecast, coming employee birthdays, overdue task and your agenda, recent activities of yourself and your peers and others. All these reports are shown in My Workspace section. Besides the ability to view reports, you can add items quickly without having to access other specific modules. You can add company news, leave requests, tasks, events, leads, cases and expense claims. In general this page is the first module you should visit when you login for the sake of quick and short information access.

